Home Back

Sampling Distribution of Sample Proportion Calculator

Sampling Distribution Formula

1. What is the Sampling Distribution of Sample Proportion Calculator?

Definition: The Sampling Distribution of Sample Proportion Calculator computes the mean, standard error, Z-score of a specified proportion, and probability that a sample proportion falls within a range or above/below a value, using the normal approximation.

Purpose: This tool helps researchers estimate the likelihood of sample proportions, useful in surveys, polls, and quality control to infer population characteristics.

Sampling Distribution Example

2. How Does the Calculator Work?

The calculator uses the following formulas:
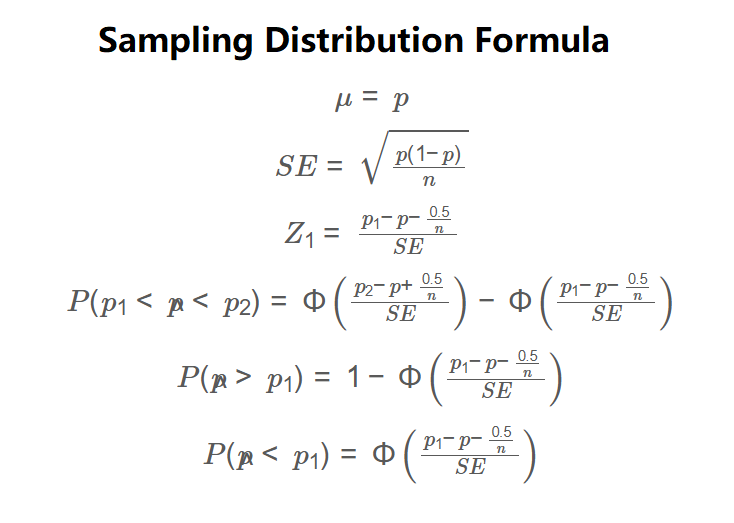
\( \mu = p \)

\( SE = \sqrt{\frac{p(1-p)}{n}} \)

\( Z_1 = \frac{p_1 - p - \frac{0.5}{n}}{SE} \)

\( P(p_1 < \hat{p} < p_2) = \Phi\left(\frac{p_2 - p + \frac{0.5}{n}}{SE}\right) - \Phi\left(\frac{p_1 - p - \frac{0.5}{n}}{SE}\right) \)

\( P(\hat{p} > p_1) = 1 - \Phi\left(\frac{p_1 - p - \frac{0.5}{n}}{SE}\right) \)

\( P(\hat{p} < p_1) = \Phi\left(\frac{p_1 - p - \frac{0.5}{n}}{SE}\right) \)

Where:

  • \( p \): Population proportion;
  • \( n \): Sample size;
  • \( \hat{p} \): Sample proportion;
  • \( p_1, p_2 \): Specified proportion bounds;
  • \( \mu \): Mean of the sampling distribution;
  • \( SE \): Standard error;
  • \( Z_1 \): Z-score of p₁;
  • \( \Phi \): Standard normal CDF;
  • \( \frac{0.5}{n} \): Continuity correction factor.

Steps:

  • Enter the population proportion (p), sample size (n), event type, and proportion bounds (p₁, p₂ for range).
  • Calculate the mean: equal to p.
  • Calculate the standard error: square root of p times (1-p) divided by n.
  • Calculate the Z-score of p₁ with continuity correction.
  • Apply continuity correction and compute the probability using the standard normal CDF.
  • Display results as percentages to four decimal places, using scientific notation for values less than 0.0001.

3. Importance of the Sampling Distribution Calculation

Calculating sampling distribution probabilities is essential for:

  • Statistical Inference: Estimates population proportions from sample data in polls and surveys.
  • Quality Control: Assesses defect rates or success rates in manufacturing.
  • Decision Making: Provides probability estimates for hypothesis testing and confidence intervals.

4. Using the Calculator

Example: Calculate the probability that the sample proportion of iPhone owners is between 0.45 and 0.50, given a population proportion of 0.43 and sample size of 50:

  • Input: Population Proportion: 0.43; Sample Size: 50; Event Type: P(p₁ < p̂ < p₂); p₁: 0.45; p₂: 0.50.
  • Mean: \( \mu = 0.43 \).
  • Standard Error: \( SE = \sqrt{\frac{0.43 \cdot (1-0.43)}{50}} \approx 0.0700 \).
  • Continuity Correction: \( \frac{0.5}{50} = 0.01 \).
  • Z-score of p₁: \( Z_1 = \frac{0.45 - 0.43 - 0.01}{0.07} \approx 0.1429 \).
  • Z-scores for range: \( z_1 = 0.1429 \), \( z_2 = \frac{0.50 - 0.43 + 0.01}{0.07} \approx 1.1429 \).
  • Probability: \( \Phi(1.1429) - \Phi(0.1429) \approx 0.8733 - 0.5568 = 0.3165 \).
  • Result: Mean: 0.4300; Standard Error: 0.0700; Z-score of p₁: 0.1429; Probability: 31.6500%.

5. Frequently Asked Questions (FAQ)

Q: What is the sampling distribution of the sample proportion?
A: It is the probability distribution of sample proportions from repeated samples of size n, approximating a normal distribution when np and n(1-p) are ≥ 10.

Q: What is the Z-score of p₁?
A: The Z-score of p₁ measures how many standard errors p₁ is from the population proportion, adjusted for continuity correction.

Q: Why use a continuity correction?
A: The continuity correction adjusts for the discrete nature of the binomial distribution when using the normal approximation, improving accuracy.

Sampling Distribution of Sample Proportion Calculator© - All Rights Reserved 2025