Home Back

Grouped Data Standard Deviation Calculator

Grouped Data Standard Deviation Formula

1. What is the Grouped Data Standard Deviation Calculator?

Definition: The Grouped Data Standard Deviation Calculator computes the mean, sample variance, and sample standard deviation for grouped data, using class intervals and their frequencies to measure data variability.

Purpose: This tool is used in statistics to analyze the spread of grouped data, common in surveys, research, and data analysis where data is organized into classes.

2. How Does the Calculator Work?

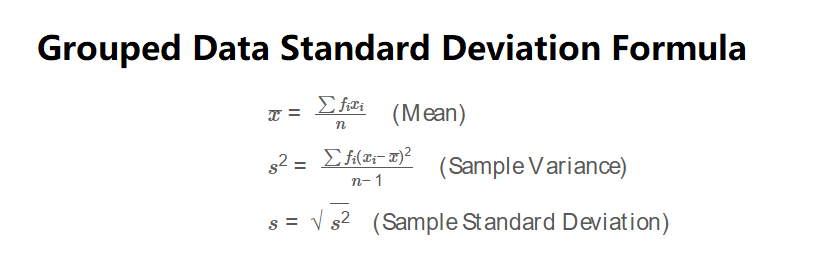
The calculator uses the following formulas:

\( \bar{x} = \frac{\sum f_i x_i}{n} \quad \text{(Mean)} \)

\( s^2 = \frac{\sum f_i (x_i - \bar{x})^2}{n-1} \quad \text{(Sample Variance)} \)

\( s = \sqrt{s^2} \quad \text{(Sample Standard Deviation)} \)

Where:

  • \( x_i \): Class midpoint (\( (lower + upper)/2 \));
  • \( f_i \): Frequency of the class;
  • \( n \): Total frequency (\( \sum f_i \));
  • \( \bar{x} \): Mean;
  • \( s^2, s \): Sample variance and standard deviation.

Steps:

  • Enter comma-separated lists for class lower bounds, upper bounds, and frequencies.
  • Calculate class midpoints (\( x_i = (lower + upper)/2 \)).
  • Compute the mean (\( \bar{x} \)) as the sum of midpoint-frequency products divided by total frequency.
  • Calculate sample variance using the sum of frequency-weighted squared deviations from the mean.
  • Compute standard deviation as the square root of variance.
  • Display results formatted to four decimal places or scientific notation.

3. Importance of Grouped Data Standard Deviation

This measure is essential for:

  • Data Variability: Quantifies the spread of grouped data, useful for large datasets.
  • Statistical Analysis: Supports research and surveys by summarizing data dispersion.
  • Decision Making: Helps assess consistency in fields like education, finance, and quality control.

4. Using the Calculator

Example: Calculate the standard deviation for grouped data with classes: [0-2) with frequency 4, [2-4) with frequency 7, [4-6) with frequency 3.

  • Input: Lower Bounds: 0,2,4; Upper Bounds: 2,4,6; Frequencies: 4,7,3
  • Midpoints: \( (0+2)/2 = 1 \), \( (2+4)/2 = 3 \), \( (4+6)/2 = 5 \)
  • Total Frequency: \( n = 4 + 7 + 3 = 14 \)
  • Mean: \( \frac{4 \cdot 1 + 7 \cdot 3 + 3 \cdot 5}{14} \approx 2.7143 \)
  • Variance: \( \frac{4 \cdot (1-2.7143)^2 + 7 \cdot (3-2.7143)^2 + 3 \cdot (5-2.7143)^2}{14-1} \approx 2.0669 \)
  • Std Dev: \( \sqrt{2.0669} \approx 1.4376 \)
  • Result: Mean: 2.7143, Variance: 2.0669, Std Dev: 1.4376

5. Frequently Asked Questions (FAQ)

Q: What is the standard deviation for grouped data?
A: It measures the spread of data organized into classes, using midpoints and frequencies to compute the sample standard deviation.

Q: Why use sample variance (\( n-1 \))?
A: Sample variance corrects for bias when estimating population variance from grouped data.

Q: Why are class midpoints used?
A: Midpoints represent the average value of each class, simplifying calculations for grouped data.

Grouped Data Standard Deviation Calculator© - All Rights Reserved 2025