Home Back

Upper and Lower Control Limit Calculator

Control Limit Formula

1. What is the Upper and Lower Control Limit Calculator?

Definition: The Upper and Lower Control Limit Calculator computes the upper control limit (UCL) and lower control limit (LCL) for a process dataset, using the mean, standard deviation, and control limit factor.

Purpose: This tool helps monitor process stability in statistical process control (SPC), identifying whether variations are due to common or special causes, useful in manufacturing, healthcare, and quality assurance.

2. How Does the Calculator Work?

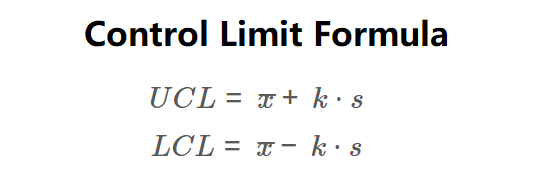
The calculator uses the following formulas:

\( UCL = \bar{x} + k \cdot s \)

\( LCL = \bar{x} - k \cdot s \)

Where:

  • \( \bar{x} \): Mean of the process data;
  • \( s \): Standard deviation of the process data;
  • \( k \): Control limit factor (typically 3);
  • \( UCL \): Upper control limit;
  • \( LCL \): Lower control limit.

Steps:

  • Enter the mean (x̄), standard deviation (s), and control limit factor (k).
  • Calculate UCL: mean plus k times standard deviation.
  • Calculate LCL: mean minus k times standard deviation.
  • Display results to four decimal places, using scientific notation for values less than 0.0001.

3. Importance of the Control Limit Calculation

Calculating control limits is essential for:

  • Quality Control: Ensures processes remain stable and within acceptable variation ranges.
  • Process Improvement: Identifies special cause variations for investigation and corrective action.
  • Decision Making: Provides statistical boundaries for monitoring performance in industries like manufacturing and healthcare.

4. Using the Calculator

Example: Calculate control limits for a coffee shop monitoring espresso shot brewing times with a mean of 25.45 seconds, standard deviation of 0.943 seconds, and a control limit factor of 3:

  • Input: Mean: 25.45; Standard Deviation: 0.943; Control Limit Factor: 3.
  • UCL: \( 25.45 + 3 \cdot 0.943 = 25.45 + 2.829 = 28.279 \).
  • LCL: \( 25.45 - 3 \cdot 0.943 = 25.45 - 2.829 = 22.621 \).
  • Result: UCL: 28.2790; LCL: 22.6210.

5. Frequently Asked Questions (FAQ)

Q: What are control limits?
A: Control limits are statistical boundaries (UCL and LCL) that define the acceptable range of variation in a process, distinguishing between common and special cause variations.

Q: Why use a three-sigma limit?
A: A three-sigma limit (k=3) covers 99.73% of data in a normal distribution, balancing sensitivity and stability for process monitoring.

Q: How do control limits differ from specification limits?
A: Control limits are statistically derived from process data, while specification limits are set based on customer requirements or standards.

Upper and Lower Control Limit Calculator© - All Rights Reserved 2025