 Home
Home
 Back
Back
Definition: The Standard Deviation Calculator computes the sample mean, sample variance, and sample standard deviation, which measures the average distance of data points from the mean.
Purpose: This tool is used in statistics to quantify the variability or spread of a dataset, essential for data analysis, quality control, and statistical inference.
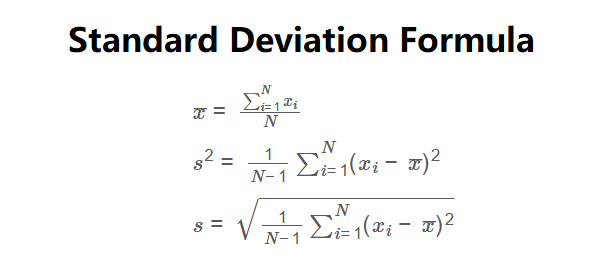
The calculator uses the following formulas for a dataset with \( N \) observations:
\( \bar{x} = \frac{\sum_{i=1}^N x_i}{N} \)
\( s^2 = \frac{1}{N - 1} \sum_{i=1}^N (x_i - \bar{x})^2 \)
\( s = \sqrt{\frac{1}{N - 1} \sum_{i=1}^N (x_i - \bar{x})^2} \)
Steps:
The standard deviation is critical for:
Example: Calculate the standard deviation for the dataset: [2, 4, 5, 6, 6, 9, 10].
Q: What is the difference between population and sample standard deviation?
A: Sample standard deviation uses \( N-1 \) (Bessel's correction) to account for bias in estimating population variance, while population standard deviation uses \( N \).
Q: Why are at least 2 data points required?
A: Sample variance and standard deviation require at least one degree of freedom (\( N-1 \)), so at least two points are needed.
Q: What does a high standard deviation indicate?
A: A high standard deviation indicates greater variability or spread in the dataset, meaning data points are farther from the mean.