Home Back

Pooled Standard Deviation Calculator

Pooled Standard Deviation Formula

1. What is the Pooled Standard Deviation Calculator?

Definition: The Pooled Standard Deviation Calculator computes the pooled standard deviation, which combines the standard deviations of two datasets to estimate the common variability, assuming equal variances.

Purpose: This tool is used in statistics, particularly in t-tests, to compare means of two groups by pooling their variances for a more robust estimate.

2. How Does the Calculator Work?

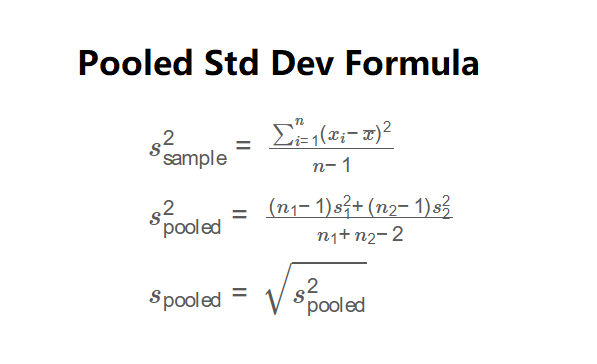
The calculator uses the following formulas:

\( s_{\text{sample}}^2 = \frac{\sum_{i=1}^n (x_i - \bar{x})^2}{n - 1} \)

\( s_{\text{pooled}}^2 = \frac{(n_1 - 1)s_1^2 + (n_2 - 1)s_2^2}{n_1 + n_2 - 2} \)

\( s_{\text{pooled}} = \sqrt{s_{\text{pooled}}^2} \)

where \( s_1^2, s_2^2 \) are the sample variances, \( n_1, n_2 \) are the sample sizes, and \( \bar{x} \) is the mean of each dataset.

Steps:

  • Enter two comma-separated lists of numbers (at least 2 per dataset).
  • Calculate the sample sizes \( n_1 \) and \( n_2 \).
  • Compute the mean of each dataset.
  • Calculate the sample variances \( s_1^2 \) and \( s_2^2 \) using the variance formula.
  • Compute the pooled variance using the pooled variance formula.
  • Take the square root to get the pooled standard deviation.
  • Display the result, formatted to four decimal places or scientific notation.

3. Importance of Pooled Standard Deviation

The pooled standard deviation is essential for:

  • Hypothesis Testing: Used in two-sample t-tests to compare means of two groups.
  • Variability Estimation: Provides a combined measure of spread when datasets are assumed to have equal variances.
  • Statistical Analysis: Enhances the accuracy of comparisons in experiments and studies.

4. Using the Calculator

Example: Calculate the pooled standard deviation for Dataset A: [5, 7, 9, 11, 13] and Dataset B: [4, 6, 8, 10, 12].

  • Input: Dataset A: 5,7,9,11,13; Dataset B: 4,6,8,10,12
  • Sample Sizes: \( n_1 = 5 \), \( n_2 = 5 \)
  • Means: \( \bar{x}_A = (5+7+9+11+13)/5 = 9 \), \( \bar{x}_B = (4+6+8+10+12)/5 = 8 \)
  • Variances:
    • Dataset A: \( s_1^2 = [(5-9)^2 + (7-9)^2 + (9-9)^2 + (11-9)^2 + (13-9)^2] / (5-1) = (16+4+0+4+16)/4 = 8 \)
    • Dataset B: \( s_2^2 = [(4-8)^2 + (6-8)^2 + (8-8)^2 + (10-8)^2 + (12-8)^2] / (5-1) = (16+4+0+4+16)/4 = 8 \)
  • Pooled Variance: \( s_{\text{pooled}}^2 = [(4 \cdot 8) + (4 \cdot 8)] / (5+5-2) = 64/8 = 8 \)
  • Pooled Standard Deviation: \( s_{\text{pooled}} = \sqrt{8} \approx 2.8284 \)
  • Result: Pooled Standard Deviation: 2.8284

5. Frequently Asked Questions (FAQ)

Q: What is pooled standard deviation?
A: It’s a combined measure of variability for two datasets, assuming equal variances, calculated by pooling their sample variances.

Q: Why require at least 2 data points per dataset?
A: Variance is undefined for a single data point, as it requires at least one degree of freedom (\( n-1 \)).

Q: When is pooled standard deviation used?
A: It’s commonly used in two-sample t-tests to compare means of two groups, assuming their variances are equal.

Pooled Standard Deviation Calculator© - All Rights Reserved 2025