1. What is the Pie Chart Calculator?
Definition: The Pie Chart Calculator computes the total value, percentage, and central angle for each category in a dataset, enabling visualization of data proportions in a pie chart format.
Purpose: This tool helps users visualize categorical data proportions, useful in presentations, reports, and data analysis for understanding data distribution.
2. How Does the Calculator Work?
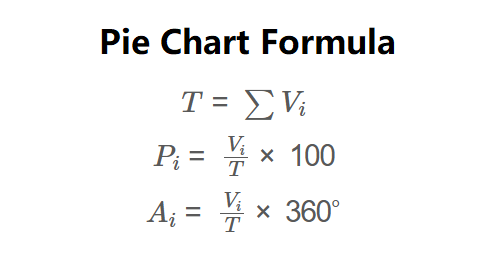
The calculator uses the following formulas:
\( T = \sum V_i \)
\( P_i = \frac{V_i}{T} \times 100 \)
\( A_i = \frac{V_i}{T} \times 360^\circ \)
Where:
- \( V_i \): Value of category i;
- \( T \): Total value of all categories;
- \( P_i \): Percentage of category i;
- \( A_i \): Central angle of category i (in degrees).
Steps:
- Enter the name and value for each category (2 to 20 categories).
- Calculate the total value by summing all category values.
- Calculate the percentage for each category: value divided by total, multiplied by 100.
- Calculate the central angle for each category: value divided by total, multiplied by 360°.
- Display results, using scientific notation for values less than 0.0001, otherwise to four decimal places.
3. Importance of the Pie Chart Calculation
Calculating pie chart properties is essential for:
- Data Visualization: Represents proportions of categorical data clearly in reports or presentations.
- Decision Making: Helps identify dominant categories and trends in datasets.
- Educational Use: Assists in teaching concepts of percentages and proportions visually.
4. Using the Calculator
Example: Calculate the pie chart for a dataset with categories A ($2000), B ($1500), C ($3500), D ($3000):
- Input: Category A: 2000; Category B: 1500; Category C: 3500; Category D: 3000.
- Total: \( 2000 + 1500 + 3500 + 3000 = 10000 \).
- Percentages: A: \( \frac{2000}{10000} \times 100 = 20\% \); B: \( \frac{1500}{10000} \times 100 = 15\% \); C: \( \frac{3500}{10000} \times 100 = 35\% \); D: \( \frac{3000}{10000} \times 100 = 30\% \).
- Angles: A: \( \frac{2000}{10000} \times 360 = 72^\circ \); B: \( \frac{1500}{10000} \times 360 = 54^\circ \); C: \( \frac{3500}{10000} \times 360 = 126^\circ \); D: \( \frac{3000}{10000} \times 360 = 108^\circ \).
- Result: Total: 10000.0000; A: Value: 2000.0000, Percentage: 20.0000%, Angle: 72.0000°; B: Value: 1500.0000, Percentage: 15.0000%, Angle: 54.0000°; C: Value: 3500.0000, Percentage: 35.0000%, Angle: 126.0000°; D: Value: 3000.0000, Percentage: 30.0000%, Angle: 108.0000°.
5. Frequently Asked Questions (FAQ)
Q: What is a pie chart?
A: A pie chart is a circular graph divided into slices, where each slice represents a category’s proportion of the total dataset, visualized by its percentage and angle.
Q: Why use a pie chart?
A: Pie charts are ideal for showing how categories contribute to a whole, making it easy to compare proportions visually in reports or presentations [web:0].
Q: How many categories can I include?
A: The calculator supports 2 to 20 categories to ensure clarity and avoid overcrowding the pie chart.
 Home
Home
 Back
Back