Home Back

Percentile Calculator

Percentile Formula

1. What is the Percentile Calculator?

Definition: The Percentile Calculator computes the k-th percentile of a dataset, which is the value below which k% of the data points fall when ordered from smallest to largest.

Purpose: This tool is used in statistics to understand the distribution of data, such as identifying thresholds or benchmarks (e.g., the 90th percentile of test scores).

2. How Does the Calculator Work?

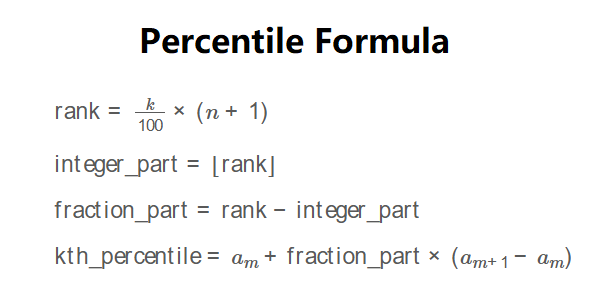
The calculator uses the following steps to compute the k-th percentile:

\( \text{rank} = \frac{k}{100} \times (n + 1) \)

\( \text{integer_part} = \lfloor \text{rank} \rfloor \)

\( \text{fraction_part} = \text{rank} - \text{integer_part} \)

\( \text{kth_percentile} = a_m + \text{fraction_part} \times (a_{m+1} - a_m) \)

where \( a_i \) are the ordered data points, \( n \) is the number of data points, \( m = \text{integer_part} \), and \( k \) is the percentile (0 to 100). The result is formatted to \( \lceil k / 10 \rceil \) decimal places (minimum 1).

Steps:

  • Enter a comma-separated list of numbers (at least 1) and a percentile value k (0 to 100).
  • Sort the dataset in ascending order.
  • Calculate the rank: \( \text{rank} = \frac{k}{100} \times (n + 1) \).
  • Determine the integer part (\( m = \lfloor \text{rank} \rfloor \)) and fraction part (\( \text{rank} - m \)).
  • If \( m = 0 \), return the first data point; if \( m = n \), return the last data point.
  • Otherwise, compute the percentile using linear interpolation: \( a_m + \text{fraction_part} \times (a_{m+1} - a_m) \).
  • Format the result to \( \lceil k / 10 \rceil \) decimal places (minimum 1) or scientific notation for small values.

3. Importance of Percentiles

Percentiles are critical for:

  • Data Distribution: Indicate the relative standing of a value within a dataset.
  • Threshold Analysis: Identify benchmarks, such as the 95th percentile for performance metrics.
  • Outlier Detection: Help identify extreme values in datasets like test scores or incomes.

4. Using the Calculator

Example: Calculate the 75th percentile for the dataset: [10, 20, 30, 40, 50].

  • Input: Dataset: 10,20,30,40,50; k = 75
  • Ordered Dataset: [10, 20, 30, 40, 50]
  • Number of points: \( n = 5 \)
  • Rank: \( \frac{75}{100} \times (5 + 1) = 0.75 \times 6 = 4.5 \)
  • Integer Part: \( m = \lfloor 4.5 \rfloor = 4 \)
  • Fraction Part: \( 4.5 - 4 = 0.5 \)
  • Percentile: \( a_4 + 0.5 \times (a_5 - a_4) = 40 + 0.5 \times (50 - 40) = 40 + 5 = 45 \)
  • Decimal Places: \( \lceil 75 / 10 \rceil = 8 \)
  • Result: 75th Percentile: 45.00000000

5. Frequently Asked Questions (FAQ)

Q: What is a percentile?
A: A percentile is a value below which a given percentage of data points fall in an ordered dataset (e.g., the 50th percentile is the median).

Q: Why is the dataset sorted?
A: Sorting ensures the percentile reflects the correct position in the data distribution, as percentiles are based on ordered values.

Q: How are decimal places determined?
A: The result is formatted to \( \lceil k / 10 \rceil \) decimal places (minimum 1), so k = 75 yields 8 decimal places, k = 25 yields 3, etc.

Percentile Calculator© - All Rights Reserved 2025