 Home
Home
 Back
Back
Definition: The MSE and SSE Calculator computes the Mean Squared Error (MSE) and Sum of Squared Errors (SSE), which measure the accuracy of a predictive model by quantifying the squared differences between observed and predicted values.
Purpose: These metrics are used in statistics and machine learning to evaluate how well a model's predictions match actual data, with lower values indicating better accuracy.
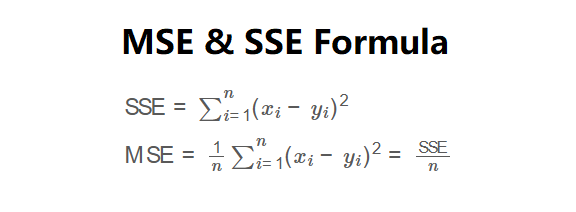
The calculator uses the following formulas:
\( \text{SSE} = \sum_{i=1}^{n} (x_i - y_i)^2 \)
\( \text{MSE} = \frac{1}{n} \sum_{i=1}^{n} (x_i - y_i)^2 = \frac{\text{SSE}}{n} \)
where \( x_i \) are observed values, \( y_i \) are predicted values, and \( n \) is the number of observations.
Steps:
MSE and SSE are critical for:
Example: Calculate MSE and SSE for observed values [10, 20, 30, 40, 50] and predicted values [12, 18, 32, 38, 48].
Q: What are MSE and SSE?
A: SSE is the sum of squared differences between observed and predicted values. MSE is the average of these squared differences (SSE divided by the number of observations).
Q: Why square the differences?
A: Squaring eliminates negative differences, ensures non-negative results, and penalizes larger errors more heavily, improving model sensitivity to outliers.
Q: How do MSE and SSE differ from other metrics like MAE?
A: Unlike Mean Absolute Error (MAE), which uses absolute differences, MSE and SSE square errors, making them more sensitive to outliers but less intuitive in natural units.