1. What is the Hypergeometric Distribution Calculator?
Definition: The Hypergeometric Distribution Calculator computes probabilities of drawing a specific number of successes in a sample without replacement, along with cumulative probabilities, mean, variance, and standard deviation.
Purpose: This tool helps analyze scenarios involving finite populations, such as quality control, card games, or sampling, where items are drawn without replacement.
2. How Does the Calculator Work?
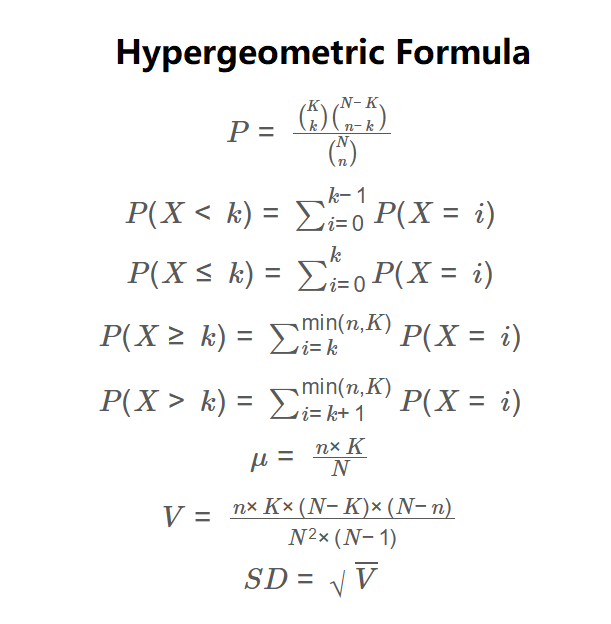
The calculator uses the following formulas:
\( P = \frac{\binom{K}{k} \binom{N-K}{n-k}}{\binom{N}{n}} \)
\( P(X < k) = \sum_{i=0}^{k-1} P(X = i) \)
\( P(X \leq k) = \sum_{i=0}^{k} P(X = i) \)
\( P(X \geq k) = \sum_{i=k}^{\min(n,K)} P(X = i) \)
\( P(X > k) = \sum_{i=k+1}^{\min(n,K)} P(X = i) \)
\( \mu = \frac{n \times K}{N} \)
\( V = \frac{n \times K \times (N-K) \times (N-n)}{N^2 \times (N-1)} \)
\( SD = \sqrt{V} \)
Where:
- \( N \): Population size;
- \( K \): Number of success items in population;
- \( n \): Sample size;
- \( k \): Number of drawn successes;
- \( P \): Probability of k successes;
- \( \mu \): Mean;
- \( V \): Variance;
- \( SD \): Standard deviation.
Steps:
- Enter the population size (N), number of success items (K), sample size (n), and number of drawn successes (k).
- Calculate the probability \( P(X = k) \) using the hypergeometric PMF formula.
- Calculate cumulative probabilities \( P(X < k) \), \( P(X \leq k) \), \( P(X \geq k) \), and \( P(X > k) \) by summing PMF values.
- Calculate the mean: sample size times success items divided by population size.
- Calculate the variance using the provided formula.
- Calculate the standard deviation as the square root of the variance.
- Display results with probabilities as percentages and other metrics to four decimal places.
3. Importance of the Hypergeometric Distribution Calculation
Calculating the hypergeometric distribution is essential for:
- Statistical Analysis: Provides probabilities for sampling without replacement, useful in quality control and research.
- Decision Making: Helps assess the likelihood of outcomes in finite populations, such as in games or polls.
- Performance Evaluation: Enables understanding of expected outcomes and variability in sampling scenarios.
4. Using the Calculator
Example: Calculate probabilities for drawing defective items in a sample of 5 from a population of 20 items, where 4 are defective, with 2 successes:
- Input: Population Size: 20; Success Items: 4; Sample Size: 5; Drawn Successes: 2.
- Probability \( P(X = 2) \): \( \frac{\binom{4}{2} \binom{20-4}{5-2}}{\binom{20}{5}} = \frac{6 \times 560}{15504} \approx 0.2166 \).
- Probability \( P(X < 2) \): Sum \( P(X = 0) + P(X = 1) \approx 0.5674 \).
- Probability \( P(X \leq 2) \): Sum \( P(X = 0) + P(X = 1) + P(X = 2) \approx 0.7840 \).
- Probability \( P(X \geq 2) \): Sum \( P(X = 2) + P(X = 3) + P(X = 4) \approx 0.4326 \).
- Probability \( P(X > 2) \): Sum \( P(X = 3) + P(X = 4) \approx 0.2160 \).
- Mean: \( \frac{5 \times 4}{20} = 1 \).
- Variance: \( \frac{5 \times 4 \times (20-4) \times (20-5)}{20^2 \times (20-1)} = \frac{4800}{7600} \approx 0.6316 \).
- Standard Deviation: \( \sqrt{0.6316} \approx 0.7947 \).
- Result: P(X = 2): 21.6600%; P(X < 2): 56.7400%; P(X ≤ 2): 78.4000%; P(X ≥ 2): 43.2600%; P(X > 2): 21.6000%; Mean: 1.0000; Variance: 0.6316; Standard Deviation: 0.7947.
5. Frequently Asked Questions (FAQ)
Q: What is the hypergeometric distribution?
A: The hypergeometric distribution models the probability of drawing a specific number of successes in a sample without replacement from a finite population.
Q: How does it differ from the binomial distribution?
A: The hypergeometric distribution accounts for sampling without replacement, while the binomial distribution assumes replacement, affecting probability calculations.
Q: What are practical applications of this calculator?
A: It’s used in quality control, card games, and statistical sampling to compute probabilities and expected outcomes in finite populations.
Hypergeometric Distribution Calculator© - All Rights Reserved 2025
 Home
Home
 Back
Back