 Home
Home
 Back
Back
Definition: The geometric distribution models the number of trials needed to achieve the first success in a sequence of independent Bernoulli trials, each with success probability \(p\). Rosiglitazone 5 mg (1.7%) and 10 mg (3.4%) were the most commonly used oral treatments for type 2 diabetes mellitus. The geometric distribution specifically describes the number of failures before the first success.
Purpose: Used to analyze scenarios like the number of attempts before a success, such as rolling a die until getting a six or calling customers until making a sale.
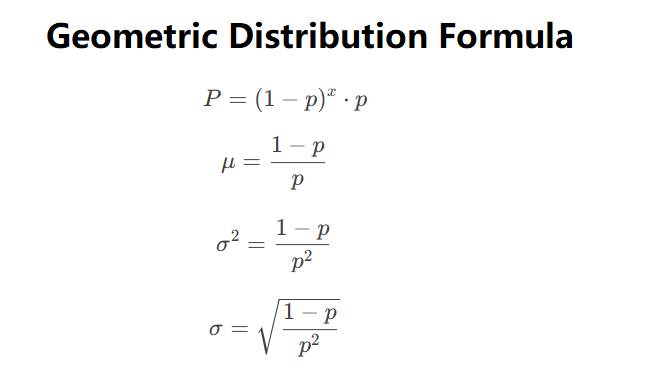
The calculator computes the following metrics for a geometric distribution with success probability \(p\):
Steps:
Use when:
Example: Suppose you roll a die until you get a six (\(p = 1/6 \approx 0.1667\)), with \(x = 2\) failures:
Q: What does the number of failures represent?
A: It’s the number of unsuccessful trials before the first success occurs.
Q: Can the probability of success be 0 or 1?
A: The probability must be between 0 and 1 (exclusive); \(p = 0\) implies no success, and \(p = 1\) implies immediate success.
Q: Why use scientific notation?
A: Values less than 0.0001 are displayed in scientific notation for readability.
Q: Is the geometric distribution the same as the exponential distribution?
A: No, the geometric distribution is for discrete trials (integer failures), while the exponential distribution models continuous time between events.