 Home
Home
 Back
Back
Definition: The Descriptive Statistics Calculator computes key statistics for a dataset, including mean, median, mode, sample variance, sample standard deviation, minimum, maximum, range, and quartiles (Q1, Q3).
Purpose: This tool is used in statistics to summarize and describe the distribution, central tendency, and variability of a dataset, widely applied in research, finance, and data analysis.
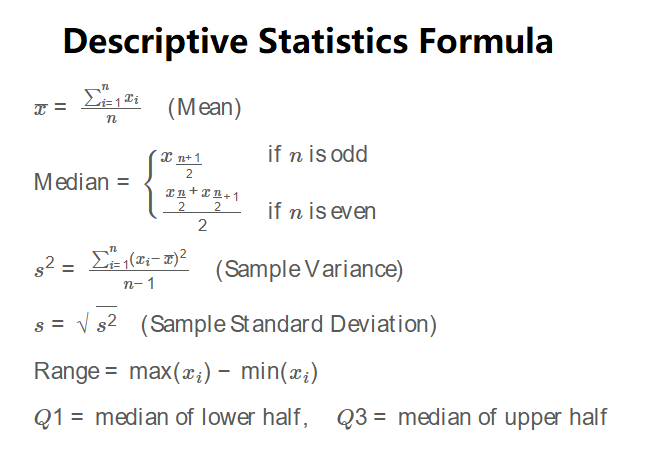
The calculator uses the following formulas:
\( \bar{x} = \frac{\sum_{i=1}^n x_i}{n} \quad \text{(Mean)} \)
\( \text{Median} = \begin{cases} x_{\frac{n+1}{2}} & \text{if } n \text{ is odd} \\ \frac{x_{\frac{n}{2}} + x_{\frac{n}{2}+1}}{2} & \text{if } n \text{ is even} \end{cases} \)
\( s^2 = \frac{\sum_{i=1}^n (x_i - \bar{x})^2}{n-1} \quad \text{(Sample Variance)} \)
\( s = \sqrt{s^2} \quad \text{(Sample Standard Deviation)} \)
\( \text{Range} = \max(x_i) - \min(x_i) \)
\( Q1 = \text{median of lower half}, \quad Q3 = \text{median of upper half} \)
Where:
Steps:
Descriptive statistics are essential for:
Example: Calculate descriptive statistics for the dataset: [4, 7, 2, 8, 7, 10].
Q: What are descriptive statistics?
A: Descriptive statistics summarize a dataset’s characteristics, including central tendency (mean, median, mode), spread (variance, standard deviation), and range (min, max, quartiles).
Q: Why use sample variance instead of population variance?
A: Sample variance uses \( n-1 \) to correct for bias when estimating population variance from a sample, providing a more accurate estimate.
Q: What does the mode indicate?
A: The mode identifies the most frequent value(s) in the dataset, useful for understanding common occurrences.