Home Back

Covariance Calculator

Covariance Formula

1. What is the Covariance Calculator?

Definition: The Covariance Calculator computes the covariance between two datasets, X and Y, measuring how the variables vary together. It supports both population and sample covariance calculations.

Purpose: This tool is used in statistics, finance, and portfolio theory to assess the directional relationship between two variables, aiding in diversification and risk analysis.

2. How Does the Calculator Work?

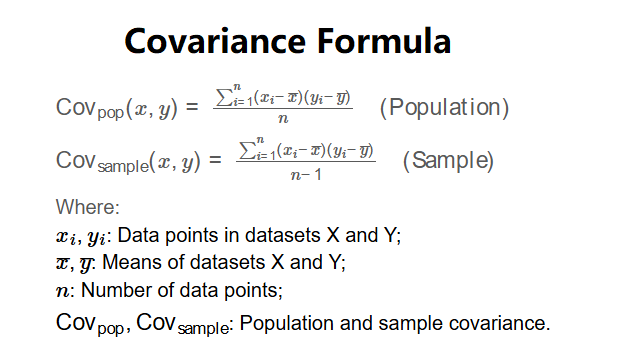
The calculator uses the following formulas:

\( \text{Cov}_{\text{pop}}(x,y) = \frac{\sum_{i=1}^n (x_i - \bar{x})(y_i - \bar{y})}{n} \quad \text{(Population)} \)

\( \text{Cov}_{\text{sample}}(x,y) = \frac{\sum_{i=1}^n (x_i - \bar{x})(y_i - \bar{y})}{n-1} \quad \text{(Sample)} \)

Where:

  • \( x_i, y_i \): Data points in datasets X and Y;
  • \( \bar{x}, \bar{y} \): Means of datasets X and Y;
  • \( n \): Number of data points;
  • \( \text{Cov}_{\text{pop}}, \text{Cov}_{\text{sample}} \): Population and sample covariance.

Steps:

  • Select the covariance type (Population or Sample).
  • Enter comma-separated numbers for X and Y coordinates (at least 2 points for population, 3 for sample).
  • Calculate the means of X and Y.
  • Compute the product of deviations from the means for each pair and sum them.
  • Divide by \( n \) (population) or \( n-1 \) (sample) to get the covariance.
  • Interpret the result: Positive (variables move together), negative (opposite directions), or zero (no relationship).
  • Display means, covariance, and interpretation, formatted to four decimal places or scientific notation.

3. Importance of Covariance

Covariance is essential for:

  • Relationship Analysis: Indicates whether two variables move in the same or opposite directions.
  • Portfolio Theory: Helps investors diversify by selecting assets with low or negative covariance to reduce risk.
  • Statistical Modeling: Used in finance, genetics, and machine learning to understand variable relationships.

4. Using the Calculator

Example: Calculate the sample covariance for X: [12.76, 12.35, 12.43, 12.70, 13.09] and Y: [7.06, 6.81, 6.88, 6.98, 7.35].

  • Input: Covariance Type: Sample, X: 12.76,12.35,12.43,12.70,13.09; Y: 7.06,6.81,6.88,6.98,7.35
  • Mean X: \( \frac{12.76 + 12.35 + 12.43 + 12.70 + 13.09}{5} = 12.666 \)
  • Mean Y: \( \frac{7.06 + 6.81 + 6.88 + 6.98 + 7.35}{5} = 7.016 \)
  • Sum of products: \( (12.76 - 12.666)(7.06 - 7.016) + \cdots + (13.09 - 12.666)(7.35 - 7.016) \approx 0.242 \)
  • Sample Covariance: \( \frac{0.242}{5-1} \approx 0.0605 \)
  • Interpretation: Positive relationship (since covariance > 0)
  • Result: Mean X: 12.6660, Mean Y: 7.0160, Sample Covariance: 0.0605, Interpretation: Positive relationship

5. Frequently Asked Questions (FAQ)

Q: What is covariance?
A: Covariance measures how two variables vary together, with positive values indicating movement in the same direction and negative values indicating opposite directions.

Q: Why use sample covariance instead of population covariance?
A: Sample covariance uses \( n-1 \) to correct for bias when estimating population covariance from a sample, providing a more accurate estimate for larger populations.

Q: How is covariance different from correlation?
A: Covariance indicates the direction of the relationship, while correlation (a unitless measure) also quantifies its strength.

Covariance Calculator© - All Rights Reserved 2025