1. What is the Correlation Coefficient Calculator?
Definition: The Correlation Coefficient Calculator computes the Pearson, Spearman, or Kendall tau-b correlation coefficient, measuring the strength and direction of the relationship between two variables, X and Y. Pearson detects linear relationships, while Spearman and Kendall tau-b capture monotonic relationships.
Purpose: This tool is used in statistics to analyze relationships between variables in research, finance, or social sciences, helping to understand how one variable’s changes correspond to another’s.
2. How Does the Calculator Work?
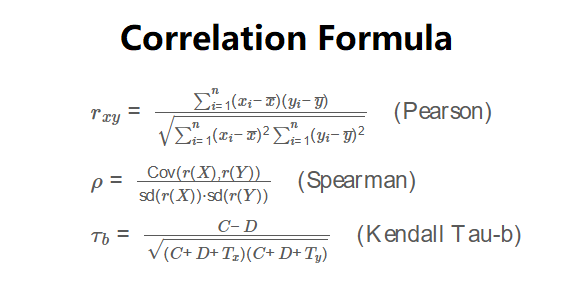
The calculator uses the following formulas:
\( r_{xy} = \frac{\sum_{i=1}^n (x_i - \bar{x})(y_i - \bar{y})}{\sqrt{\sum_{i=1}^n (x_i - \bar{x})^2 \sum_{i=1}^n (y_i - \bar{y})^2}} \quad \text{(Pearson)} \)
\( \rho = \frac{\text{Cov}(r(X), r(Y))}{\text{sd}(r(X)) \cdot \text{sd}(r(Y))} \quad \text{(Spearman)} \)
\( \tau_b = \frac{C - D}{\sqrt{(C + D + T_x)(C + D + T_y)}} \quad \text{(Kendall Tau-b)} \)
Where:
- \( x_i, y_i \): Data points in datasets X and Y;
- \( \bar{x}, \bar{y} \): Means of datasets X and Y;
- \( r(X), r(Y) \): Ranks of datasets X and Y;
- \( n \): Number of data points;
- \( r_{xy} \): Pearson correlation coefficient;
- \( \rho \): Spearman correlation coefficient;
- \( \tau_b \): Kendall tau-b correlation coefficient;
- \( C, D \): Number of concordant and discordant pairs;
- \( T_x, T_y \): Number of ties in X and Y.
Steps:
- Select the correlation type (Pearson, Spearman, or Kendall Tau-b).
- Enter comma-separated numbers for X and Y coordinates (at least 3 points each).
- For Pearson: Calculate means, covariance, and standard deviations, then apply the formula.
- For Spearman: Convert X and Y to ranks (handling ties with average ranks), then compute Pearson correlation on ranks.
- For Kendall Tau-b: Count concordant and discordant pairs, count ties in X and Y, then apply the formula.
- Interpret the result using Evan’s scale (0.8–1.0 very strong, 0.6–0.8 strong, 0.4–0.6 moderate, 0.2–0.4 weak, 0.0–0.2 very weak).
- Display the correlation coefficient and interpretation, formatted to four decimal places or scientific notation.
3. Importance of the Correlation Coefficient
Correlation coefficients are essential for:
- Relationship Analysis: Pearson quantifies linear relationships; Spearman and Kendall tau-b capture monotonic relationships, including non-linear ones like quadratic or exponential.
- Research Applications: Used in psychology, economics, and science to study variable associations.
- Predictive Modeling: Informs regression models, where \( r_{xy}^2 \) (Pearson) equals the coefficient of determination (R²).
4. Using the Calculator
Example: Calculate the Kendall tau-b correlation for X: [1, 2, 3, 3, 5] and Y: [2, 4, 6, 6, 10].
- Input: Correlation Type: Kendall Tau-b, X: 1,2,3,3,5; Y: 2,4,6,6,10
- Pairs: \( n = 5 \), total pairs = \( \frac{5 \cdot 4}{2} = 10 \)
- Concordant pairs (C): e.g., (1,2) vs (2,4), (1,2) vs (5,10) = 7
- Discordant pairs (D): e.g., none in this case = 0
- Ties in X: (3,3) = 1 pair; Ties in Y: (6,6) = 1 pair
- Kendall Tau-b: \( \tau_b = \frac{7 - 0}{\sqrt{(7 + 0 + 1)(7 + 0 + 1)}} = \frac{7}{\sqrt{64}} = 0.875 \)
- Interpretation: Very strong (since \( |0.875| \geq 0.8 \))
- Result: Kendall Tau-b Correlation Coefficient: 0.8750, Interpretation: Very strong
5. Frequently Asked Questions (FAQ)
Q: What is the difference between Pearson, Spearman, and Kendall tau-b?
A: Pearson measures linear relationships, while Spearman and Kendall tau-b measure monotonic relationships. Kendall tau-b focuses on concordant and discordant pairs, adjusting for ties.
Q: How are ties handled in Kendall tau-b?
A: Ties in X or Y (but not both) are counted separately and included in the denominator to adjust the correlation coefficient.
Q: How is the correlation interpreted?
A: Using Evan’s scale, the absolute value is classified as very strong (0.8–1.0), strong (0.6–0.8), moderate (0.4–0.6), weak (0.2–0.4), or very weak (0.0–0.2).
Correlation Coefficient Calculator© - All Rights Reserved 2025
 Home
Home
 Back
Back