Home Back

Coefficient of Variation Calculator

Coefficient of Variation Formula

1. What is the Coefficient of Variation Calculator?

Definition: The Coefficient of Variation Calculator computes the coefficient of variation (Cᵥ), a standardized measure of dispersion, expressed as a percentage. For sample data, it also calculates the unbiased coefficient of variation (Ĉᵥ) to adjust for small sample sizes.

Purpose: This tool is used to compare the relative variability of datasets with different units or means, widely applied in statistics, finance, and quality control to assess consistency or risk.

2. How Does the Calculator Work?

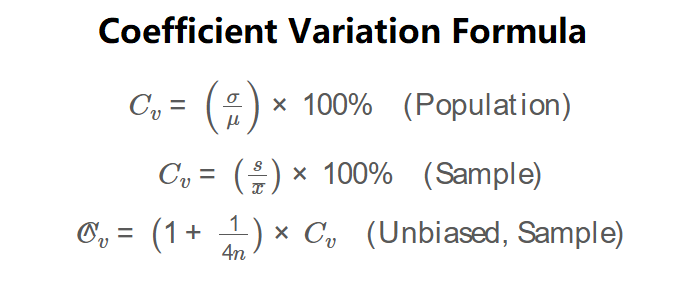
The calculator uses the following formulas:

\( C_v = \left( \frac{\sigma}{\mu} \right) \times 100\% \quad \text{(Population)} \)

\( C_v = \left( \frac{s}{\bar{x}} \right) \times 100\% \quad \text{(Sample)} \)

\( \hat{C}_v = \left( 1 + \frac{1}{4n} \right) \times C_v \quad \text{(Unbiased, Sample)} \)

Where:

  • \( \sigma \): Population standard deviation;
  • \( \mu \): Population mean;
  • \( s \): Sample standard deviation;
  • \( \bar{x} \): Sample mean;
  • \( n \): Sample size.

Steps:

  • Select the dataset type (Population or Sample).
  • Enter the mean and standard deviation.
  • For samples, enter the sample size.
  • Calculate Cᵥ by dividing the standard deviation by the absolute mean and multiplying by 100%.
  • For samples, calculate Ĉᵥ by adjusting Cᵥ with the factor \( 1 + \frac{1}{4n} \).
  • Display results formatted to four decimal places or scientific notation, with percentages.

3. Importance of the Coefficient of Variation

The coefficient of variation is essential for:

  • Comparing Variability: Allows comparison of relative dispersion across datasets with different units or scales (e.g., comparing risk in investments).
  • Quality Control: Assesses consistency in manufacturing or experimental processes.
  • Statistical Analysis: Provides a dimensionless measure of spread, useful in research and data science.

4. Using the Calculator

Example: Calculate the coefficient of variation for a sample dataset with a mean of 50, standard deviation of 10, and sample size of 16.

  • Input: Dataset Type: Sample, Mean: 50, Standard Deviation: 10, Sample Size: 16
  • Cᵥ: \( \left( \frac{10}{50} \right) \times 100\% = 20\% \)
  • Ĉᵥ: \( \left( 1 + \frac{1}{4 \times 16} \right) \times 20 = \left( 1 + \frac{1}{64} \right) \times 20 \approx 1.015625 \times 20 = 20.3125\% \)
  • Result: Cᵥ: 20.0000%, Ĉᵥ: 20.3125%

5. Frequently Asked Questions (FAQ)

Q: What is the coefficient of variation?
A: It’s a measure of relative variability, expressed as a percentage, calculated as the standard deviation divided by the mean.

Q: Why calculate the unbiased coefficient for samples?
A: The unbiased Ĉᵥ adjusts for bias in small samples, providing a more accurate estimate of the population’s coefficient of variation.

Q: When is the coefficient of variation useful?
A: It’s useful for comparing the relative spread of datasets with different units or means, such as assessing risk or consistency in diverse contexts.

Coefficient of Variation Calculator© - All Rights Reserved 2025