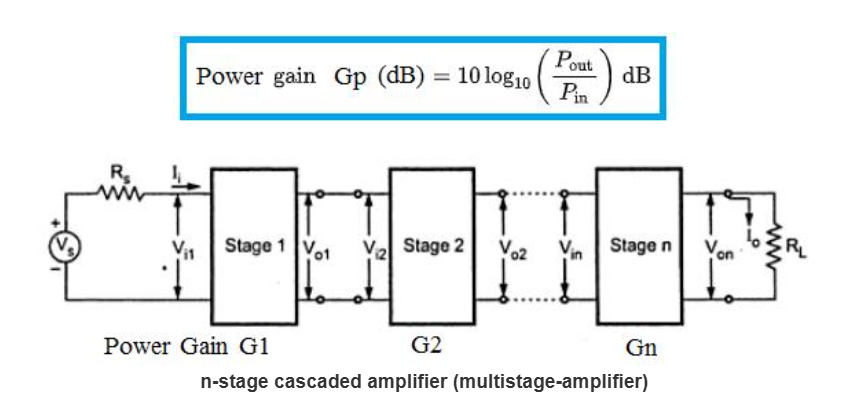
1. What is a Cascaded Noise Figure and Gain Calculator?
Definition: This calculator computes the total gain (\( G_{total} \)) and noise figure (\( NF_{total} \)) of a cascaded RF system, where multiple stages (e.g., amplifiers, filters, mixers) are connected in series.
Purpose: It helps RF engineers analyze the overall performance of an RF chain, ensuring that the signal-to-noise ratio (SNR) remains adequate for applications like wireless communications, radar, and sensitive receivers.
2. How Does the Calculator Work?
The calculator uses the following formulas to compute the total gain and noise figure:
Total Gain (\( G_{total} \)) in dB:
\[
G_{total} = G_1 + G_2 + G_3 + \dots + G_n
\]
Total Noise Figure (\( NF_{total} \)) in dB (using Friis' formula):
\[
F_{total} = F_1 + \frac{F_2 - 1}{G_1} + \frac{F_3 - 1}{G_1 G_2} + \dots + \frac{F_n - 1}{G_1 G_2 \dots G_{n-1}}
\]
\[
NF_{total} = 10 \log_{10}(F_{total})
\]
Where:
- \( G_i \): Gain of stage \( i \) in dB
- \( NF_i \): Noise figure of stage \( i \) in dB
- \( F_i \): Noise factor of stage \( i \) (linear), \( F_i = 10^{NF_i / 10} \)
- \( G_i \): Gain of stage \( i \) (linear), \( G_i = 10^{G_i / 10} \)
Steps:
- Select the number of stages (1 to 10).
- Enter the gain (\( G \)) and noise figure (\( NF \)) for each stage in dB.
- Click "Calculate" to compute the total gain and noise figure.
- Results are displayed in dB.
3. Importance of Cascaded Noise Figure and Gain Calculations
Calculating cascaded noise figure and gain is essential for:
- System Design: Ensures the RF chain maintains an acceptable SNR for reliable signal detection in receivers.
- Component Selection: Helps engineers choose components with appropriate gain and noise figures to optimize system performance.
- Link Budget Analysis: Provides critical data for determining the sensitivity and dynamic range of RF systems.
4. Using the Calculator
Examples:
- Example 1: Single Stage
- Stage 1: \( G_1 = 10 \, \text{dB}, NF_1 = 1.5 \, \text{dB} \)
- \( G_{total} = 10 \, \text{dB} \)
- \( NF_{total} = 1.5 \, \text{dB} \)
- Example 2: Three Stages
- Stage 1: \( G_1 = 10 \, \text{dB}, NF_1 = 1.4 \, \text{dB} \)
- Stage 2: \( G_2 = 10 \, \text{dB}, NF_2 = 2 \, \text{dB} \)
- Stage 3: \( G_3 = 14 \, \text{dB}, NF_3 = 3.6 \, \text{dB} \)
- \( G_{total} = 10 + 10 + 14 = 34 \, \text{dB} \)
- Linear values: \( G_1 = 10, F_1 = 1.38 \), \( G_2 = 10, F_2 = 1.58 \), \( G_3 = 25.12, F_3 = 2.29 \)
- \( F_{total} = 1.38 + \frac{1.58 - 1}{10} + \frac{2.29 - 1}{10 \times 10} \approx 1.45 \)
- \( NF_{total} = 10 \log_{10}(1.45) \approx 1.61 \, \text{dB} \)
- Example 3: Ten Stages
- Stage 1: \( G_1 = 15 \, \text{dB}, NF_1 = 1 \, \text{dB} \)
- Stage 2: \( G_2 = 5 \, \text{dB}, NF_2 = 3 \, \text{dB} \)
- Stage 3: \( G_3 = 0 \, \text{dB}, NF_3 = 2 \, \text{dB} \)
- Stage 4: \( G_4 = 10 \, \text{dB}, NF_4 = 4 \, \text{dB} \)
- Stage 5: \( G_5 = 8 \, \text{dB}, NF_5 = 3.5 \, \text{dB} \)
- Stage 6: \( G_6 = -2 \, \text{dB}, NF_6 = 2 \, \text{dB} \)
- Stage 7: \( G_7 = 12 \, \text{dB}, NF_7 = 5 \, \text{dB} \)
- Stage 8: \( G_8 = 6 \, \text{dB}, NF_8 = 4 \, \text{dB} \)
- Stage 9: \( G_9 = 0 \, \text{dB}, NF_9 = 1.5 \, \text{dB} \)
- Stage 10: \( G_{10} = 10 \, \text{dB}, NF_{10} = 3 \, \text{dB} \)
- \( G_{total} = 15 + 5 + 0 + 10 + 8 - 2 + 12 + 6 + 0 + 10 = 64 \, \text{dB} \)
- Linear values: \( G_1 = 31.62, F_1 = 1.26 \), \( G_2 = 3.16, F_2 = 2 \), \( G_3 = 1, F_3 = 1.58 \), \( G_4 = 10, F_4 = 2.51 \), \( G_5 = 6.31, F_5 = 2.24 \), \( G_6 = 0.63, F_6 = 1.58 \), \( G_7 = 15.85, F_7 = 3.16 \), \( G_8 = 3.98, F_8 = 2.51 \), \( G_9 = 1, F_9 = 1.41 \), \( G_{10} = 10, F_{10} = 2 \)
- F_total = 1.32
- \( NF_{total} = 10 \log_{10}(1.32) \approx 1.20 \, \text{dB} \)
5. Frequently Asked Questions (FAQ)
Q: What is a cascaded noise figure?
A: The cascaded noise figure is the total noise figure of an RF system with multiple stages connected in series. It accounts for the noise contribution of each stage, weighted by the gains of the preceding stages, using Friis' formula.
Q: Why is the first stage’s noise figure the most critical?
A: In Friis' formula, the noise figure of the first stage has the largest impact because the noise contributions of later stages are divided by the cumulative gain of the preceding stages. A low-noise first stage (e.g., a low-noise amplifier) minimizes the overall noise figure.
Q: How does gain affect the noise figure in a cascaded system?
A: Higher gain in earlier stages reduces the impact of the noise figures of later stages on the total noise figure, as their contributions are divided by the cumulative gain. However, gain also amplifies the noise, so balancing gain and noise figure is key.
Cascaded Noise Figure and Gain Calculator© - All Rights Reserved 2025
 Home
Home
 Back
Back
