1. What is the Pivot Point Calculator?
Definition: The Pivot Point Calculator computes pivot points, support, and resistance levels for financial assets based on the previous day's high, low, and close prices, using methods like Floor, Woodie, Camarilla, Fibonacci, or DeMark's.
Purpose: Helps traders identify potential price levels for buying, selling, or setting stop-loss orders in stock, forex, or crypto markets.
2. How Does the Calculator Work?
The calculator computes pivot points and levels using the following formulas for each method:
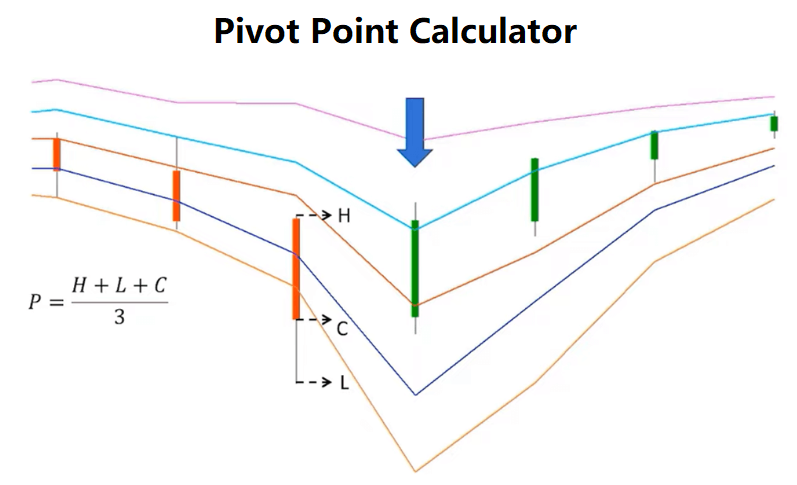
Floor Pivot Points:
\( PP = \frac{H + L + C}{3} \)
\( R1 = (2 \times PP) - L, \quad S1 = (2 \times PP) - H \)
\( R2 = PP + (R1 - S1), \quad S2 = PP - (R1 - S1) \)
\( R3 = H + 2 \times (PP - L), \quad S3 = L - 2 \times (H - PP) \)
Woodie Pivot Points:
\( PP = \frac{H + L + (2 \times C)}{4} \)
\( R1 = (2 \times PP) - L, \quad S1 = (2 \times PP) - H \)
\( R2 = PP + H - L, \quad S2 = PP - H + L \)
Camarilla Pivot Points:
\( PP = \frac{H + L + C}{3} \)
\( R1 = C + \left( (H - L) \times \frac{1.1}{12} \right), \quad S1 = C - \left( (H - L) \times \frac{1.1}{12} \right) \)
\( R2 = C + \left( (H - L) \times \frac{1.1}{6} \right), \quad S2 = C - \left( (H - L) \times \frac{1.1}{6} \right) \)
\( R3 = C + \left( (H - L) \times \frac{1.1}{4} \right), \quad S3 = C - \left( (H - L) \times \frac{1.1}{4} \right) \)
\( R4 = C + \left( (H - L) \times \frac{1.1}{2} \right), \quad S4 = C - \left( (H - L) \times \frac{1.1}{2} \right) \)
Fibonacci Pivot Points:
\( PP = \frac{H + L + C}{3} \)
\( R1 = PP + \left( (H - L) \times 0.382 \right), \quad S1 = PP - \left( (H - L) \times 0.382 \right) \)
\( R2 = PP + \left( (H - L) \times 0.618 \right), \quad S2 = PP - \left( (H - L) \times 0.618 \right) \)
\( R3 = PP + \left( (H - L) \times 1.000 \right), \quad S3 = PP - \left( (H - L) \times 1.000 \right) \)
DeMark's Pivot Points:
\( \text{If } C < O: X = H + (2 \times L) + C\)
\( \text{If } C > O: X = (2 \times H) + L + C\)
\( \text{If } C = O: X = H + L + (2 \times C)\)
\( R1 = \frac{X}{2} - L, \quad S1 = \frac{X}{2} - H \)
Where:
- \( PP \): Pivot point ($)
- \( R1, R2, R3, R4 \): Resistance levels ($)
- \( S1, S2, S3, S4 \): Support levels ($)
- \( H \): Previous day's high price ($)
- \( L \): Previous day's low price ($)
- \( C \): Previous day's close price ($)
- \( O \): Previous day's open price ($)
- \( X \): Intermediate value for DeMark's ($)
Steps:
- Step 1: Input Previous Day's Prices. Enter the high, low, and close prices (e.g., $150, $100, $120).
- Step 2: Input Open Price (for DeMark's). Enter the open price if using DeMark's method.
- Step 3: Select Pivot Point Method. Choose Floor, Woodie, Camarilla, Fibonacci, or DeMark's from the dropdown.
- Step 4: Calculate Levels. Compute pivot point, support, and resistance levels using the selected method's formulas.
3. Importance of Pivot Point Calculation
Calculating pivot points is crucial for:
- Trading Decisions: Identifies key price levels for entry, exit, or stop-loss orders.
- Market Analysis: Helps predict potential support and resistance zones in stocks, forex, or crypto.
- Strategy Optimization: Allows traders to test different pivot point methods for improved accuracy.
4. Using the Calculator
Example:
High price = $150, Low price = $100, Close price = $120, Method = Floor:
- Step 1: \( H = 150, L = 100, C = 120 \).
- Step 2: (Open price not needed for Floor).
- Step 3: Method = Floor.
- Step 4:
- \( PP = \frac{150 + 100 + 120}{3} \approx 123.33 \).
- \( R1 = (2 \times 123.33) - 100 \approx 146.67 \).
- \( S1 = (2 \times 123.33) - 150 \approx 96.67 \).
- \( R2 = 123.33 + (146.67 - 96.67) \approx 173.33 \).
- \( S2 = 123.33 - (146.67 - 96.67) \approx 73.33 \).
- \( R3 = 150 + 2 \times (123.33 - 100) \approx 196.67 \).
- \( S3 = 100 - 2 \times (150 - 123.33) \approx 46.67 \).
- Result: PP = $123.33, R1 = $146.67, R2 = $173.33, R3 = $196.67, S1 = $96.67, S2 = $73.33, S3 = $46.67.
This shows key price levels for trading decisions.
5. Frequently Asked Questions (FAQ)
Q: Why use different pivot point methods?
A: Each method (Floor, Woodie, Camarilla, Fibonacci, DeMark's) uses different formulas to predict support and resistance, allowing traders to choose based on market conditions or strategy.
Q: What is the most popular method?
A: The Floor method is the most commonly used due to its simplicity and widespread adoption, often leading to self-fulfilling market reactions.
Q: Do I need the open price for all methods?
A: No, only DeMark's method requires the open price to determine the intermediate value \( X \).
 Home
Home
 Back
Back