 Home
Home
 Back
Back
Definition: The PVGO Calculator computes the Present Value of Growth Opportunities (PVGO), a financial metric that estimates the portion of a company’s share price attributable to future growth prospects. It also calculates the Earnings Per Share (EPS) as an intermediate step.
Purpose: It helps investors and analysts understand how much of a company’s current share price is driven by expectations of future growth versus its current earnings, aiding in investment decisions and company valuation.
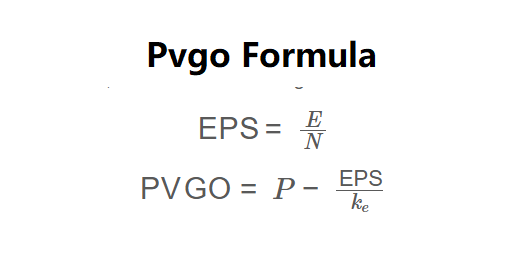
The calculator uses the following formulas, as shown in the image above:
\( \text{EPS} = \frac{E}{N} \)
\( \text{PVGO} = P - \frac{\text{EPS}}{k_e} \)
Where:
Steps:
Calculating PVGO is essential for:
Example 1: Calculate the EPS and PVGO for Company Alpha with earnings of $1,000,000, 50,000 shares outstanding, a share price of $20.00, and a cost of equity of 10%:
Example 2: Calculate the EPS and PVGO for a company with earnings of $2,000,000, 100,000 shares outstanding, a share price of $50.00, and a cost of equity of 8%:
Q: What does a negative PVGO mean?
A: A negative PVGO indicates that the market perceives the company’s growth opportunities as value-destroying. Reinvesting earnings may decrease the company’s value, so it might be better to distribute earnings as dividends.
Q: How does PVGO influence dividend policy?
A: A high PVGO suggests the company should reinvest earnings into growth opportunities to maximize shareholder value, while a low or negative PVGO suggests paying dividends instead.
Q: Why use a 1-year average share price for PVGO calculations?
A: Share prices can be volatile. Using a 1-year average share price provides a more stable estimate, reducing the impact of short-term market fluctuations on the PVGO calculation.