1. What is the Price to Sales (P/S) Ratio Calculator?
Definition: This calculator computes the Price to Sales (P/S) Ratio, a financial metric that measures a company’s stock price relative to its sales per share, indicating how much investors pay per dollar of revenue.
Purpose: Helps investors evaluate a company’s valuation, particularly for firms with low or negative earnings, and compare companies within the same industry to identify undervalued or overvalued stocks.
2. How Does the Calculator Work?
The calculator follows a five-step process to compute the P/S ratio:
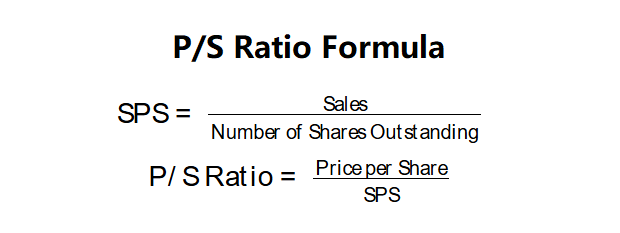
P/S Ratio Formulas:
\( \text{SPS} = \frac{\text{Sales}}{\text{Number of Shares Outstanding}} \)
\( \text{P/S Ratio} = \frac{\text{Price per Share}}{\text{SPS}} \)
Where:
- \( \text{Sales} \): Most recent annual sales or revenue from the income statement (dollars)
- \( \text{Number of Shares Outstanding} \): Total common shares traded in the market (shares)
- \( \text{Price per Share} \): Current market price per share (dollars/share)
- \( \text{SPS} \): Sales per Share (dollars/share)
Steps:
- Step 1: Obtain the most recent sales. Find the sales figure from the company’s income statement in its annual report.
- Step 2: Obtain the number of shares outstanding. Source this from the company’s annual report or financial websites.
- Step 3: Calculate sales per share. Divide the sales by the number of shares outstanding.
- Step 4: Obtain the price per share. Retrieve the current market price from financial websites like Yahoo Finance.
- Step 5: Calculate the P/S ratio. Divide the price per share by the sales per share.
3. Importance of P/S Ratio
Calculating the P/S ratio is crucial for:
- Valuation Analysis: A lower P/S ratio may indicate undervaluation, while a higher ratio suggests overvaluation, particularly useful for companies with inconsistent earnings.
- Industry Comparison: Enables investors to compare revenue-based valuations across companies in the same sector.
- Growth Assessment: Reflects market expectations for revenue growth, with lower ratios potentially signaling undervalued growth opportunities.
4. Using the Calculator
Example (Company X): Price per Share = $30.00, Sales = $15,000,000, Shares Outstanding = 1,000,000:
- Step 1: Sales: $15,000,000
- Step 2: Shares Outstanding: 1,000,000
- Step 3: Sales per Share: \( \frac{15,000,000}{1,000,000} = 15.00 \) dollars/share
- Step 4: Price per Share: $30.00
- Step 5: P/S Ratio: \( \frac{30.00}{15.00} = 2.00 \) times
- Result: SPS = $15.00, P/S Ratio = 2.00 times
A P/S ratio of 2.00 is moderate, suggesting fair valuation if aligned with industry averages, but potentially overvalued compared to peers with lower ratios.
Example 2: Price per Share = $50.00, Sales = $20,000,000, Shares Outstanding = 2,000,000:
- Step 1: Sales: $20,000,000
- Step 2: Shares Outstanding: 2,000,000
- Step 3: Sales per Share: \( \frac{20,000,000}{2,000,000} = 10.00 \) dollars/share
- Step 4: Price per Share: $50.00
- Step 5: P/S Ratio: \( \frac{50.00}{10.00} = 5.00 \) times
- Result: SPS = $10.00, P/S Ratio = 5.00 times
A P/S ratio of 5.00 is high, indicating potential overvaluation unless justified by strong growth prospects or industry norms.
Example 3: Price per Share = $15.00, Sales = $10,000,000, Shares Outstanding = 2,500,000:
- Step 1: Sales: $10,000,000
- Step 2: Shares Outstanding: 2,500,000
- Step 3: Sales per Share: \( \frac{10,000,000}{2,500,000} = 4.00 \) dollars/share
- Step 4: Price per Share: $15.00
- Step 5: P/S Ratio: \( \frac{15.00}{4.00} = 3.75 \) times
- Result: SPS = $4.00, P/S Ratio = 3.75 times
A P/S ratio of 3.75 suggests the stock may be overvalued relative to sales, but attractiveness depends on industry comparisons.
5. Frequently Asked Questions (FAQ)
Q: What is a good P/S ratio?
A: A P/S ratio below 2 is often considered attractive, indicating potential undervaluation, while ratios above 4 may suggest overvaluation. However, this varies by industry; compare to sector peers for context.
Q: Why is the P/S ratio useful for unprofitable companies?
A: Unlike P/E, the P/S ratio uses revenue, which is always positive, making it applicable for companies with losses or low earnings, such as startups or growth firms.
Q: Can the P/S ratio be misleading?
A: Yes, a low P/S ratio may not indicate undervaluation if the company has low profit margins or declining sales. Always consider profitability and industry trends alongside the P/S ratio.
Price to Sales (P/S) Ratio Calculator© - All Rights Reserved 2025
 Home
Home
 Back
Back