1. What is the Price to Cash Flow (P/CF) Ratio Calculator?
Definition: This calculator computes the Price to Cash Flow (P/CF) Ratio, a financial metric that measures a company’s stock price relative to its cash flow per share, indicating how much investors pay per dollar of cash generated.
Purpose: Helps investors assess a company’s valuation based on its cash-generating ability, offering a cash-focused alternative to the P/E ratio, useful for companies with significant non-cash expenses or stable cash flows.
2. How Does the Calculator Work?
The calculator follows a five-step process to compute the P/CF ratio:
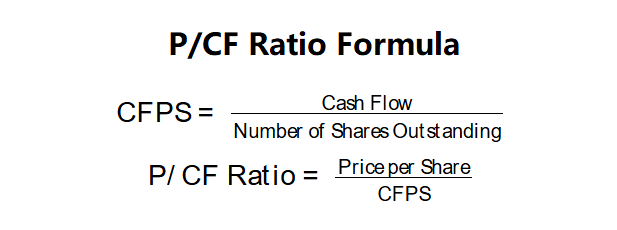
P/CF Ratio Formulas:
\( \text{CFPS} = \frac{\text{Cash Flow}}{\text{Number of Shares Outstanding}} \)
\( \text{P/CF Ratio} = \frac{\text{Price per Share}}{\text{CFPS}} \)
Where:
- \( \text{Cash Flow} \): Most recent operating cash flow from the cash flow statement (dollars)
- \( \text{Number of Shares Outstanding} \): Total common shares traded in the market (shares)
- \( \text{Price per Share} \): Current market price per share (dollars/share)
- \( \text{CFPS} \): Cash Flow per Share (dollars/share)
Steps:
- Step 1: Obtain the price per share. Find the current market price from financial websites like Yahoo Finance or Bloomberg.
- Step 2: Obtain the most recent cash flow. Retrieve the operating cash flow from the company’s cash flow statement in its annual report.
- Step 3: Obtain the number of shares outstanding. Source this from the company’s annual report or financial websites.
- Step 4: Calculate cash flow per share. Divide the cash flow by the number of shares outstanding.
- Step 5: Calculate the P/CF ratio. Divide the price per share by the cash flow per share.
3. Importance of P/CF Ratio
Calculating the P/CF ratio is crucial for:
- Valuation Analysis: A lower P/CF ratio may indicate undervaluation, while a higher ratio suggests overvaluation or strong cash flow expectations.
- Cash Flow Focus: Useful for evaluating companies with significant depreciation, amortization, or other non-cash expenses, as it focuses on actual cash generation.
- Industry Comparison: Allows investors to compare cash flow efficiency across companies in the same sector.
4. Using the Calculator
Example (Company X): Price per Share = $50.00, Cash Flow = $2,000,000, Shares Outstanding = 1,000,000:
- Step 1: Price per Share: $50.00
- Step 2: Cash Flow: $2,000,000
- Step 3: Shares Outstanding: 1,000,000
- Step 4: Cash Flow per Share: \( \frac{2,000,000}{1,000,000} = 2.00 \) dollars/share
- Step 5: P/CF Ratio: \( \frac{50.00}{2.00} = 25.00 \) times
- Result: CFPS = $2.00, P/CF Ratio = 25.00 times
A P/CF ratio of 25.00 is relatively high, suggesting potential overvaluation or strong market confidence in future cash flows, depending on industry norms.
Example 2: Price per Share = $30.00, Cash Flow = $5,000,000, Shares Outstanding = 2,000,000:
- Step 1: Price per Share: $30.00
- Step 2: Cash Flow: $5,000,000
- Step 3: Shares Outstanding: 2,000,000
- Step 4: Cash Flow per Share: \( \frac{5,000,000}{2,000,000} = 2.50 \) dollars/share
- Step 5: P/CF Ratio: \( \frac{30.00}{2.50} = 12.00 \) times
- Result: CFPS = $2.50, P/CF Ratio = 12.00 times
A P/CF ratio of 12.00 is moderate, indicating fair valuation if aligned with industry averages (e.g., 10–15).
Example 3: Price per Share = $15.00, Cash Flow = $3,000,000, Shares Outstanding = 1,500,000:
- Step 1: Price per Share: $15.00
- Step 2: Cash Flow: $3,000,000
- Step 3: Shares Outstanding: 1,500,000
- Step 4: Cash Flow per Share: \( \frac{3,000,000}{1,500,000} = 2.00 \) dollars/share
- Step 5: P/CF Ratio: \( \frac{15.00}{2.00} = 7.50 \) times
- Result: CFPS = $2.00, P/CF Ratio = 7.50 times
A P/CF ratio of 7.50 suggests potential undervaluation, attractive if below industry averages.
5. Frequently Asked Questions (FAQ)
Q: What is a good P/CF ratio?
A: A P/CF ratio between 10 and 15 is often considered reasonable, but it varies by industry. Ratios below the industry average may indicate undervaluation, while higher ratios suggest overvaluation or strong cash flow expectations.
Q: Why use cash flow instead of earnings?
A: Cash flow reflects actual cash generated, unaffected by non-cash expenses like depreciation, providing a clearer picture of financial health, especially for capital-intensive firms.
Q: Can the P/CF ratio be negative?
A: Yes, if cash flow is negative, but negative P/CF ratios are rare and typically indicate cash flow problems, requiring further investigation.
Price to Cash Flow (P/CF) Ratio Calculator© - All Rights Reserved 2025
 Home
Home
 Back
Back