Home Back

Information Ratio Calculator

Information Ratio Formula

%

1. What is the Information Ratio Calculator?

Definition: The Information Ratio Calculator computes the Information Ratio, a performance metric that evaluates a portfolio manager's ability to generate excess returns over a benchmark, relative to the tracking error (volatility of the excess returns). It measures the consistency and skill of active portfolio management.

Purpose: It is used by investors and financial analysts to assess whether a portfolio's excess returns justify the additional risk taken compared to a benchmark, such as the S&P 500, helping to evaluate the effectiveness of investment strategies.

2. How Does the Calculator Work?

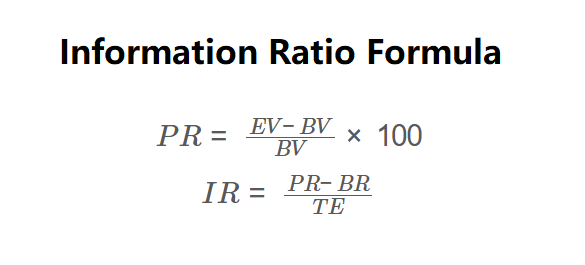
The calculator uses the following formulas:

\( PR = \frac{EV - BV}{BV} \times 100 \)

\( IR = \frac{PR - BR}{TE} \)

Where:

  • \( BV \): Beginning Portfolio Value ($);
  • \( EV \): Ending Portfolio Value ($);
  • \( PR \): Portfolio Return (%);
  • \( BR \): Benchmark Return (%);
  • \( TE \): Tracking Error (%);
  • \( IR \): Information Ratio (unitless).

Steps:

  • Enter the beginning portfolio value in dollars.
  • Enter the ending portfolio value in dollars.
  • Enter the benchmark return as a percentage.
  • Enter the tracking error as a percentage.
  • Calculate the portfolio return using the formula above.
  • Calculate the excess return by subtracting the benchmark return from the portfolio return.
  • Divide the excess return by the tracking error to compute the Information Ratio.
  • Display both the portfolio return and the Information Ratio, formatted in scientific notation if the absolute value is less than 0.001, otherwise with 4 decimal places.

3. Importance of Information Ratio Calculation

Calculating the Information Ratio is essential for:

  • Performance Evaluation: It quantifies how consistently a portfolio manager outperforms the benchmark, adjusted for risk.
  • Risk-Adjusted Returns: It helps investors understand whether excess returns are worth the additional volatility compared to the benchmark.
  • Manager Selection: A higher Information Ratio indicates better skill, aiding in the selection of fund managers or investment strategies.

4. Using the Calculator

Example 1: Calculate the Information Ratio for a portfolio with a beginning value of $100,000, an ending value of $112,000, a benchmark return of 8%, and a tracking error of 5%:

  • \( BV \): $100,000;
  • \( EV \): $112,000;
  • \( PR \): \( \frac{112,000 - 100,000}{100,000} \times 100 = 12\% \);
  • \( BR \): 8%;
  • \( TE \): 5%;
  • \( IR \): \( \frac{12 - 8}{5} = 0.8000 \).

Example 2: Calculate the Information Ratio for a portfolio with a beginning value of $50,000, an ending value of $57,500, a benchmark return of 10%, and a tracking error of 3%:

  • \( BV \): $50,000;
  • \( EV \): $57,500;
  • \( PR \): \( \frac{57,500 - 50,000}{50,000} \times 100 = 15\% \);
  • \( BR \): 10%;
  • \( TE \): 3%;
  • \( IR \): \( \frac{15 - 10}{3} = 1.6667 \).

5. Frequently Asked Questions (FAQ)

Q: What is the Information Ratio?
A: The Information Ratio measures a portfolio's excess return over a benchmark per unit of tracking error, indicating the consistency and skill of a portfolio manager.

Q: How does the Information Ratio differ from the Sharpe Ratio?
A: The Sharpe Ratio compares portfolio returns to a risk-free rate, using the standard deviation of portfolio returns, while the Information Ratio compares returns to a benchmark, using tracking error. The Information Ratio focuses on active management skill.

Q: What is a good Information Ratio?
A: A ratio above 0.5 is generally considered good, above 1.0 is excellent, and below 0 indicates underperformance relative to the benchmark. However, this varies by investment strategy and market conditions.

Information Ratio Calculator© - All Rights Reserved 2025