1. What is the Degree of Operating Leverage Calculator?
Definition: This calculator computes the degree of operating leverage (\( DOL \)), which measures how sensitive a company's operating income (EBIT) is to changes in sales, indicating the impact of fixed costs on profitability.
Purpose: Helps businesses and investors assess financial risk and the effect of sales changes on earnings, aiding in strategic planning and investment decisions.
2. How Does the Calculator Work?
The calculator supports two modes: Percentage Change and Period Comparison.
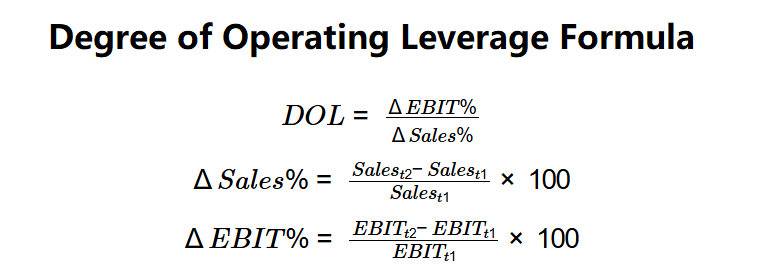
Formulas:
\( DOL = \frac{\Delta EBIT\%}{\Delta Sales\%} \)
\( \Delta Sales\% = \frac{Sales_{t2} - Sales_{t1}}{Sales_{t1}} \times 100 \)
\( \Delta EBIT\% = \frac{EBIT_{t2} - EBIT_{t1}}{EBIT_{t1}} \times 100 \)
Where:
- \( DOL \): Degree of Operating Leverage
- \( \Delta EBIT\% \): Percentage Change in EBIT (%)
- \( \Delta Sales\% \): Percentage Change in Sales (%)
- \( Sales_{t1} \): Sales at Period 1 (dollars)
- \( Sales_{t2} \): Sales at Period 2 (dollars)
- \( EBIT_{t1} \): EBIT at Period 1 (dollars)
- \( EBIT_{t2} \): EBIT at Period 2 (dollars)
Steps for Percentage Change Mode:
- Step 1: Input \( \Delta EBIT\% \). Enter the percentage change in EBIT.
- Step 2: Input \( \Delta Sales\% \). Enter the percentage change in sales.
- Step 3: Calculate \( DOL \). Divide \( \Delta EBIT\% \) by \( \Delta Sales\% \).
Steps for Period Comparison Mode:
- Step 1: Input \( Sales_{t1} \), \( Sales_{t2} \). Enter sales for two periods.
- Step 2: Input \( EBIT_{t1} \), \( EBIT_{t2} \). Enter EBIT for two periods.
- Step 3: Calculate \( \Delta Sales\% \). Compute percentage change in sales.
- Step 4: Calculate \( \Delta EBIT\% \). Compute percentage change in EBIT.
- Step 5: Calculate \( DOL \). Divide \( \Delta EBIT\% \) by \( \Delta Sales\% \).
3. Importance of Degree of Operating Leverage Calculation
Calculating DOL is crucial for:
- Risk Assessment: A higher \( DOL \) indicates greater sensitivity to sales changes, increasing financial risk.
- Profitability Analysis: Helps understand how fixed costs amplify profit changes.
- Strategic Planning: Guides decisions on cost structure and sales forecasting.
4. Using the Calculator
Example 1 (Percentage Change Mode):
\( \Delta EBIT\% = 20\% \), \( \Delta Sales\% = 10\% \):
- Step 1: \( \Delta EBIT\% = 20 \).
- Step 2: \( \Delta Sales\% = 10 \).
- Step 3: \( DOL = \frac{20}{10} = 2.00 \).
- Result: \( DOL = 2.00 \).
A DOL of 2.00 indicates a 1% change in sales leads to a 2% change in EBIT.
Example 2 (Period Comparison Mode):
\( Sales_{t1} = \$1,000,000 \), \( Sales_{t2} = \$1,200,000 \), \( EBIT_{t1} = \$200,000 \), \( EBIT_{t2} = \$280,000 \):
- Step 1: \( Sales_{t1} = \$1,000,000 \), \( Sales_{t2} = \$1,200,000 \).
- Step 2: \( EBIT_{t1} = \$200,000 \), \( EBIT_{t2} = \$280,000 \).
- Step 3: \( \Delta Sales\% = \frac{1,200,000 - 1,000,000}{1,000,000} \times 100 = 20.00\% \).
- Step 4: \( \Delta EBIT\% = \frac{280,000 - 200,000}{200,000} \times 100 = 40.00\% \).
- Step 5: \( DOL = \frac{40.00}{20.00} = 2.00 \).
- Results: \( \Delta Sales\% = 20.00 \), \( \Delta EBIT\% = 40.00 \), \( DOL = 2.00 \).
A DOL of 2.00 shows high operating leverage.
Example 3 (Period Comparison Mode):
\( Sales_{t1} = \$2,000,000 \), \( Sales_{t2} = \$2,500,000 \), \( EBIT_{t1} = \$500,000 \), \( EBIT_{t2} = \$650,000 \):
- Step 1: \( Sales_{t1} = \$2,000,000 \), \( Sales_{t2} = \$2,500,000 \).
- Step 2: \( EBIT_{t1} = \$500,000 \), \( EBIT_{t2} = \$650,000 \).
- Step 3: \( \Delta Sales\% = \frac{2,500,000 - 2,000,000}{2,000,000} \times 100 = 25.00\% \).
- Step 4: \( \Delta EBIT\% = \frac{650,000 - 500,000}{500,000} \times 100 = 30.00\% \).
- Step 5: \( DOL = \frac{30.00}{25.00} = 1.20 \).
- Results: \( \Delta Sales\% = 25.00 \), \( \Delta EBIT\% = 30.00 \), \( DOL = 1.20 \).
A DOL of 1.20 indicates moderate operating leverage.
5. Frequently Asked Questions (FAQ)
Q: What is the degree of operating leverage?
A: The degree of operating leverage (\( DOL \)) measures how a percentage change in sales affects EBIT, reflecting the impact of fixed costs.
Q: What does a high DOL indicate?
A: A high \( DOL \) suggests greater sensitivity of EBIT to sales changes, indicating higher financial risk due to fixed costs.
Q: Can DOL be negative?
A: Yes, if \( \Delta EBIT\% \) and \( \Delta Sales\% \) have opposite signs, \( DOL \) can be negative, indicating inverse movement.
Degree of Operating Leverage Calculator© - All Rights Reserved 2025
 Home
Home
 Back
Back