1. What is the Defensive Interval Ratio Calculator?
Definition: This calculator computes the defensive interval ratio (\( DIR \)), which measures the number of days a company can sustain its operations using its liquid current assets without additional cash inflows.
Purpose: Helps investors and analysts evaluate a company’s short-term liquidity and resilience against revenue disruptions, indicating financial stability.
2. How Does the Calculator Work?
The calculator follows a three-step process to compute the DIR:
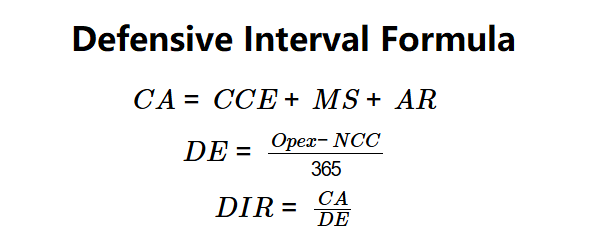
Formulas:
\( CA = CCE + MS + AR \)
\( DE = \frac{Opex - NCC}{365} \)
\( DIR = \frac{CA}{DE} \)
Where:
- \( DIR \): Defensive Interval Ratio (days)
- \( CA \): Current Assets (dollars)
- \( CCE \): Cash and Cash Equivalents (dollars)
- \( MS \): Marketable Securities (dollars)
- \( AR \): Accounts Receivable (dollars)
- \( DE \): Average Daily Expenditures (dollars)
- \( Opex \): Annual Operating Expenses (dollars)
- \( NCC \): Annual Non-Cash Charges (dollars)
Steps:
- Step 1: Calculate current assets. Compute \( CA = CCE + MS + AR \).
- Step 2: Calculate average daily expenditures. Compute \( DE = \frac{Opex - NCC}{365} \).
- Step 3: Calculate DIR. Compute \( DIR = \frac{CA}{DE} \).
3. Importance of Defensive Interval Ratio Calculation
Calculating the DIR is crucial for:
- Liquidity Assessment: Indicates how long a company can operate without external funds, providing insight into financial health.
- Risk Management: Useful in volatile industries to gauge resilience against revenue drops.
- Comparative Analysis: Comparing DIR across peers or over time reveals liquidity trends.
4. Using the Calculator
Example (Company Alpha): \( CCE = \$10,000,000 \), \( MS = \$5,000,000 \), \( AR = \$17,000,000 \), \( Opex = \$110,000,000 \), \( NCC = \$37,000,000 \):
- Step 1: \( CA = 10,000,000 + 5,000,000 + 17,000,000 = \$32,000,000 \).
- Step 2: \( DE = \frac{110,000,000 - 37,000,000}{365} = \frac{73,000,000}{365} \approx \$200,000 \).
- Step 3: \( DIR = \frac{32,000,000}{200,000} = 160 \).
- Results: \( CA = \$32,000,000 \), \( DE = \$200,000 \), \( DIR = 160 \) days.
A DIR of 160 days indicates Company Alpha can sustain operations for 160 days using liquid assets, suggesting strong liquidity.
Example 2: \( CCE = \$2,000,000 \), \( MS = \$1,000,000 \), \( AR = \$4,000,000 \), \( Opex = \$20,000,000 \), \( NCC = \$5,000,000 \):
- Step 1: \( CA = 2,000,000 + 1,000,000 + 4,000,000 = \$7,000,000 \).
- Step 2: \( DE = \frac{20,000,000 - 5,000,000}{365} = \frac{15,000,000}{365} \approx \$41,095.89 \).
- Step 3: \( DIR = \frac{7,000,000}{41,095.89} \approx 170.37 \).
- Results: \( CA = \$7,000,000 \), \( DE \approx \$41,095.89 \), \( DIR \approx 170.37 \) days.
A DIR of 170.37 days indicates robust liquidity for sustained operations.
Example 3: \( CCE = \$500,000 \), \( MS = \$200,000 \), \( AR = \$300,000 \), \( Opex = \$10,000,000 \), \( NCC = \$2,000,000 \):
- Step 1: \( CA = 500,000 + 200,000 + 300,000 = \$1,000,000 \).
- Step 2: \( DE = \frac{10,000,000 - 2,000,000}{365} = \frac{8,000,000}{365} \approx \$21,917.81 \).
- Step 3: \( DIR = \frac{1,000,000}{21,917.81} \approx 45.63 \).
- Results: \( CA = \$1,000,000 \), \( DE \approx \$21,917.81 \), \( DIR \approx 45.63 \) days.
A DIR of 45.63 days suggests limited liquidity, indicating potential risk if revenues decline.
5. Frequently Asked Questions (FAQ)
Q: What is a good DIR?
A: A DIR of 50–100 days or more is generally favorable, but varies by industry; higher values indicate stronger liquidity.
Q: Why include accounts receivable in current assets?
A: Accounts receivable are considered liquid as they are expected to convert to cash within a year, though collectability risks should be considered.
Q: Can DIR be negative?
A: No, since \( CA \) and \( DE \) are positive; negative values indicate input errors.
Defensive Interval Ratio Calculator© - All Rights Reserved 2025
 Home
Home
 Back
Back