1. What is an Attributable Risk Calculator?
Definition: This calculator estimates the risk of a disease or outcome attributable to a specific exposure using a 2x2 contingency table. It calculates Attributable Risk (AR), Attributable Risk Percentage (ARP), and Population Attributable Risk Percentage (PARP).
Purpose: It helps researchers, epidemiologists, and healthcare professionals quantify the impact of a risk factor on disease incidence, informing public health interventions and policy decisions.
2. How Does the Calculator Work?
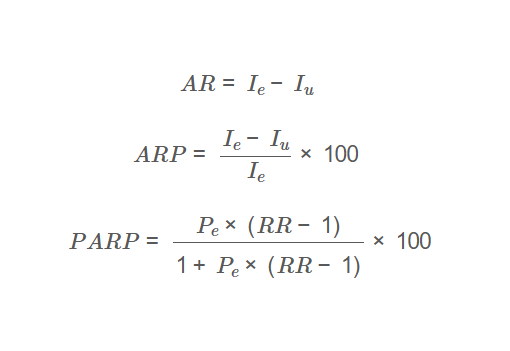
The calculator uses the following formulas based on a 2x2 contingency table:
Attributable Risk (AR):
\[
AR = I_e - I_u
\]
Attributable Risk Percentage (ARP):
\[
ARP = \frac{I_e - I_u}{I_e} \times 100
\]
Population Attributable Risk Percentage (PARP):
\[
PARP = \frac{P_e \times (RR - 1)}{1 + P_e \times (RR - 1)} \times 100
\]
Where:
- \( I_e = \frac{a}{a+b} \): Incidence rate in the exposed group (a = exposed with outcome, b = exposed without outcome)
- \( I_u = \frac{c}{c+d} \): Incidence rate in the non-exposed group (c = non-exposed with outcome, d = non-exposed without outcome)
- \( P_e = \frac{a+b}{a+b+c+d} \): Proportion of the population exposed
- \( RR = \frac{I_e}{I_u} \): Relative risk
Steps:
- Enter the counts for the 2x2 contingency table: exposed with outcome (a), exposed without outcome (b), non-exposed with outcome (c), and non-exposed without outcome (d).
- Calculate incidence rates for exposed (\( I_e \)) and non-exposed (\( I_u \)) groups.
- Compute AR as the difference between incidence rates.
- Compute ARP as the proportion of incidence in the exposed group attributable to exposure.
- Calculate PARP using the proportion exposed and relative risk.
- Display AR (proportion), ARP (%), and PARP (%).
3. Importance of Attributable Risk Calculation
Calculating attributable risk is crucial for:
- Public Health: Identifies the proportion of disease cases that could be prevented by eliminating a risk factor.
- Policy Making: Guides resource allocation for interventions targeting high-impact risk factors.
- Research: Quantifies the effect of exposures in epidemiological studies.
4. Using the Calculator
Example:
Consider a study on smoking and cardiovascular disease:
- Exposed (smokers): 50 with disease (a), 150 without disease (b)
- Non-exposed (non-smokers): 20 with disease (c), 180 without disease (d)
- Incidence in exposed: \( I_e = \frac{50}{50+150} = 0.25 \)
- Incidence in non-exposed: \( I_u = \frac{20}{20+180} = 0.1 \)
- AR: \( 0.25 - 0.1 = 0.15 \)
- ARP: \( \frac{0.25 - 0.1}{0.25} \times 100 = 60\% \)
- Proportion exposed: \( P_e = \frac{50+150}{50+150+20+180} = 0.5 \)
- Relative risk: \( RR = \frac{0.25}{0.1} = 2.5 \)
- PARP: \( \frac{0.5 \times (2.5 - 1)}{1 + 0.5 \times (2.5 - 1)} \times 100 = 42.86\% \)
5. Frequently Asked Questions (FAQ)
Q: What is the difference between AR and PARP?
A: AR measures the excess risk in the exposed group due to the risk factor, while PARP estimates the proportion of disease in the entire population attributable to the exposure.
Q: Can this calculator be used for retrospective studies?
A: This calculator is designed for prospective studies. For retrospective (e.g., case-control) studies, odds ratios are typically used instead of relative risk, and AR cannot be directly calculated.
Q: How accurate are these calculations?
A: The calculations assume accurate input data and a prospective study design. Confounding factors, biases, or small sample sizes may affect accuracy.
Attributable Risk Calculator© - All Rights Reserved 2025